VSCode Chrome Debugger 配置详解
VSCode node Debuger 配置详解链接
灵活调试之变量
7 种打断点的方式:DOM 断点、Event Listener 断点、Url 请求断点
- args 是 program 参数;runtimeArgs 是 runtimeExecutable 的参数
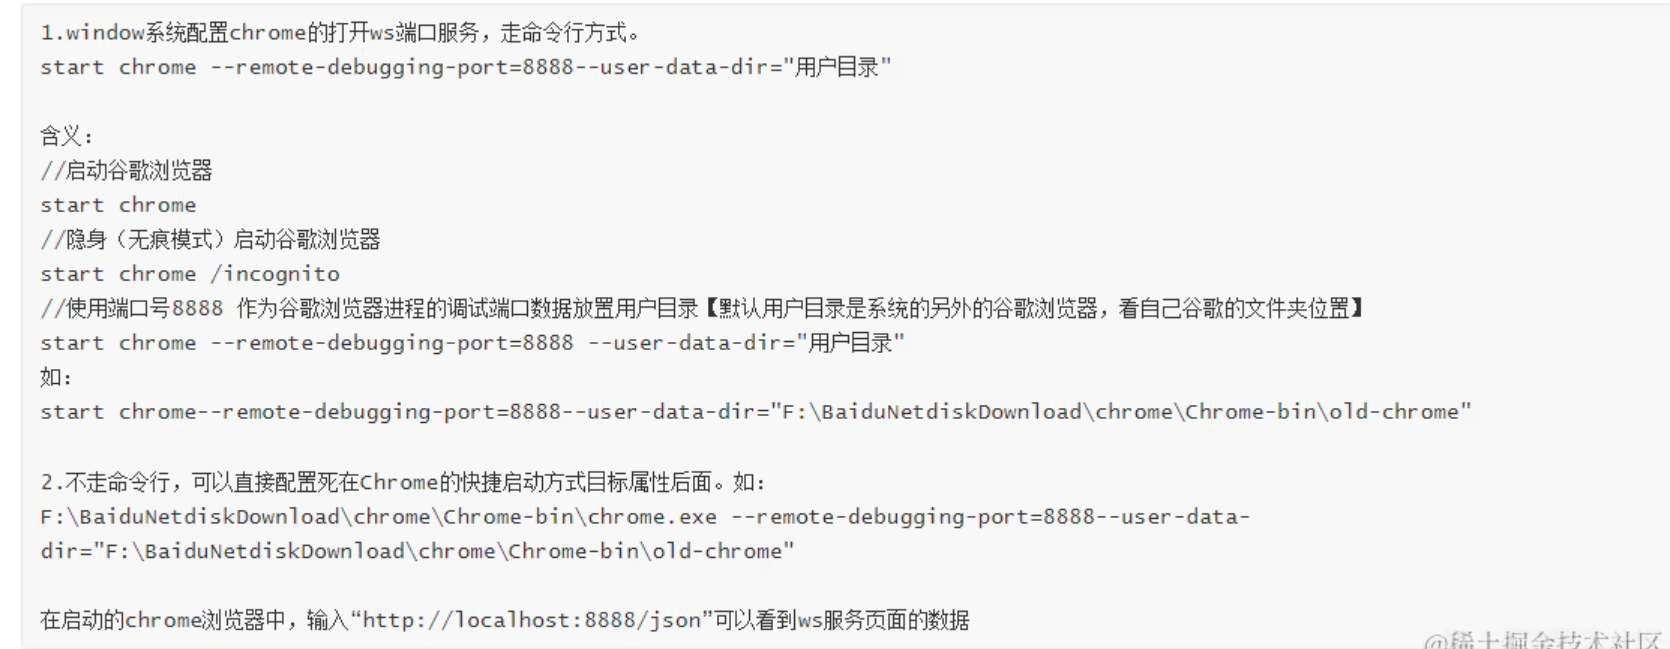
windows 命令行启动 chrome 并打开 ws 服务端口
配置后可使用 /json 访问 ws 服务页面数据
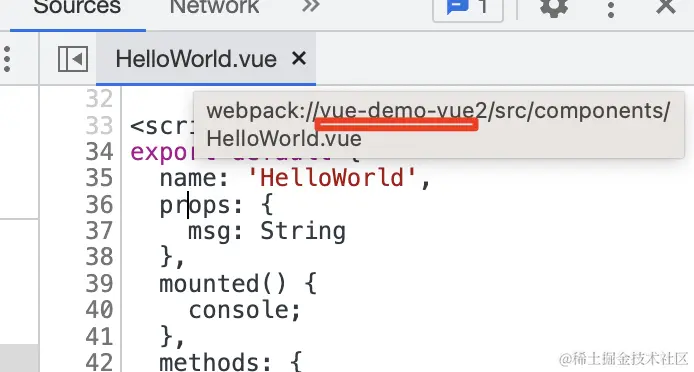
由 @vue/cli 构建
参考
vue3
devtools 需从默认的 <font style="color:rgb(37, 41, 51);">eval-cheap-module-source-map</font> 切换为 <font style="color:rgb(37, 41, 51);">source-map</font>。
| const { defineConfig } = require("@vue/cli-service");
module.exports = defineConfig({
transpileDependencies: true,
configureWebpack: (config) => {
config.devtool = "source-map";
},
});
|
vue2
配置 launch.json 需要自己添加映射。观察 Chrome DevTools 中的是否存在项目名
| "sourceMapPathOverrides": {
"webpack://你的项目名/src/*": "${workspaceFolder}/src/*"
"webpack:///src/*": "${workspaceFolder}/src/*"
}
|
由 create vue 构建 (vite)
跟 react 一样,创一个默认的 launch.json 都可以开启调试。并非完全按照以下方式配置
| {
"configurations": [
{
"type": "chrome",
"request": "launch",
"name": "调试 vite 项目",
"runtimeArgs": ["--auto-open-devtools-for-tabs"],
"userDataDir": false,
"url": "http://localhost:5173",
"webRoot": "${workspaceFolder}"
}
]
}
|
Electron 调试主进程
1
2
3
4
5
6
7
8
9
10
11
12
13
14
15
16
17
18
19
20
21
| {
"version": "0.2.0",
"configurations": [
{
"name": "Debug Main Process",
"type": "node",
"request": "launch",
"cwd": "${workspaceFolder}",
"runtimeExecutable": "${workspaceFolder}/node_modules/.bin/electron",
"windows": {
"runtimeExecutable": "${workspaceFolder}/node_modules/.bin/electron.cmd"
},
"args" : ["."],
"env": {
"NODE_ENV": "development"
},
"sourceMaps": true,
}
]
}
|
断点打不上?
参考
如果 sourcemap 到的文件路径不是本地路径,那就映射不到本地文件,导致断点打不上,这时候可以配置下 <u><font style="color:rgb(37, 41, 51);">sourceMapPathOverrides</font></u>。如果映射之后路径开头多了几层目录,那就要配置下 <u><font style="color:rgb(37, 41, 51);">webRoot</font></u>。
| "sourceMapPathOverrides": {
"webpack://你的项目名/src/*": "${workspaceFolder}/src/*",
"webpack:///src/*": "${workspaceFolder}/src/*",
}
"webRoot": "${workspaceFolder}/projectName*"
|